Building a GitOps pipeline pt. 4
We’ve now arrived at the last stretch of this journey. As mentioned in the previous post, we will now try and establish some ways to increase the visibility on what’s happening in our cluster. This will imply two things: on one hand, we will improve the app that was built for this project, with the objective of imbuing it with an integration to an event monitoring system; and then we will build the event monitoring system itself.
Improving the backend#
We’re got to admit that we’re somewhat lucky, in that Golang is the perfect choice for building the kind of app we wanted: with a very simple logic, we’re able to integrate Prometheus into what we already have. So much so, that very little of what we already built is going to be changed (there’s only a single exception to this), with most of the work is about adding simple observability code by leveraging the existing prometheus Go client.
The single change we did was changing the handler function, that now looks like this:
func withMetrics(next http.Handler) http.HandlerFunc {
	return func(w http.ResponseWriter, r *http.Request) {
		start := time.Now()
		wrapped := &responseWriter{ResponseWriter: w, statusCode: http.StatusOK}
		next.ServeHTTP(wrapped, r)
		duration := time.Since(start).Seconds()
		requestCount.WithLabelValues(r.Method, r.URL.Path, strconv.Itoa(wrapped.statusCode)).Inc()
		requestDuration.WithLabelValues(r.Method, r.URL.Path).Observe(duration)
	}
}
This middleware, which takes an http.Handler as an argument, returns a function that starts by registering the time when the request starts processing, captures the HTTP status code by making use of the wrapped variable (which was instantiated as a custom responseWriter struct), collects the duration of the request processing time, and finally increments the requestCount count and introduces a new data point on the requestDuration histogram that live in Prometheus. These last two variables are part of the code that was newly introduced in this version of the app, and are rather simple to understand:
var (
	requestCount = prometheus.NewCounterVec(
		prometheus.CounterOpts{
			Name: "http_requests_total",
			Help: "Total number of HTTP requests",
		},
		[]string{"method", "endpoint", "status"},
	)
	requestDuration = prometheus.NewHistogramVec(
		prometheus.HistogramOpts{
			Name: "http_request_duration_seconds",
			Help: "HTTP request duration (in s)",
		},
		[]string{"method", "endpoint"},
	)
)
The rest of the changes are mostly related with boilerplate for Prometheus, and adding new endpoints for testing. You can see the full diff of the changes over in the git repository where the app lives. With this in place, and with the new version of the app deployed in our cluster (remember, we now have automated deployments!), it’s time to go for the installation of Prometheus and co.
Monitoring and logging#
Prometheus and Grafana#
By now, everyone is pretty much familiarized with this stack. We use Prometheus for collecting metrics that interest us, Grafana for displaying dashboards with those metrics, and Loki for having a bit more insight into what’s happening inside our cluster. Let us start by installing and configuring Prometheus. This is easy making use of an helm chart and a pretty standard prometheus-values.yaml file:
grafana:
  adminPassword: --- # add your password here
  persistence:
    enabled: true
    size: 5Gi
  ingress:
    enabled: true
    ingressClassName: cilium
    hosts:
    - grafana.gitops-demo.local
prometheus:
  prometheusSpec:
    retention: 7d
    serviceMonitorSelector:
      matchLabels: {}  # Watch all ServiceMonitors regardless of labels
    serviceMonitorNamespaceSelector:
      matchLabels: {}  # Watch ServiceMonitors in all namespaces
    storageSpec:
      volumeClaimTemplate:
        spec:
          accessModes: ["ReadWriteOnce"]
          resources:
            requests:
              storage: 10Gi
alertmanager:
  enabled: true
  ingress:
    enabled: true
    ingressClassName: cilium
    hosts:
    - alerts.gitops-demo.local
With this in place, we can install both Prometheus and Grafana all at once with the handy helm chart:
helm repo add prometheus-community https://prometheus-community.github.io/helm-charts
helm repo update
helm install prometheus prometheus-community/kube-prometheus-stack \
  -n monitoring \
  --create-namespace \
  -f prometheus-values.yaml
This is bound to take a few minutes, which is there the kubectl wait --for=condition=ready pod -l release=prometheus -n monitoring --timeout=600s comes in really handy. After everything is running, it’s also time to add another line to /etc/hosts, so that we have DNS resolution: <your-ip> grafana.gitops-demo.local alerts.gitops-demo.local. After that’s out of the way, we will need another manifest for ServiceMontior:
apiVersion: monitoring.coreos.com/v1
kind: ServiceMonitor
metadata:
  name: gitops-demo
  labels:
    app: gitops-demo
spec:
  selector:
    matchLabels:
      app: gitops-demo
  endpoints:
  - port: http
    interval: 30s
    path: /metrics
This servicemontior.yaml file will live in your base directory, so that it’s applied equally across all your environments. Once that’s done, you can apply the changes: kubectl apply -k {dev,staging,prod}. If all went well, we can now start to configure grafana to show us some stats about our app. This is a simple example that shows us the metrics that our app exposes:
{
"dashboard": { "id": null,
"title": "GitOps Demo App Metrics",
"tags": ["gitops", "prometheus"],
"timezone": "browser",
"panels": [
{
"id": 1,
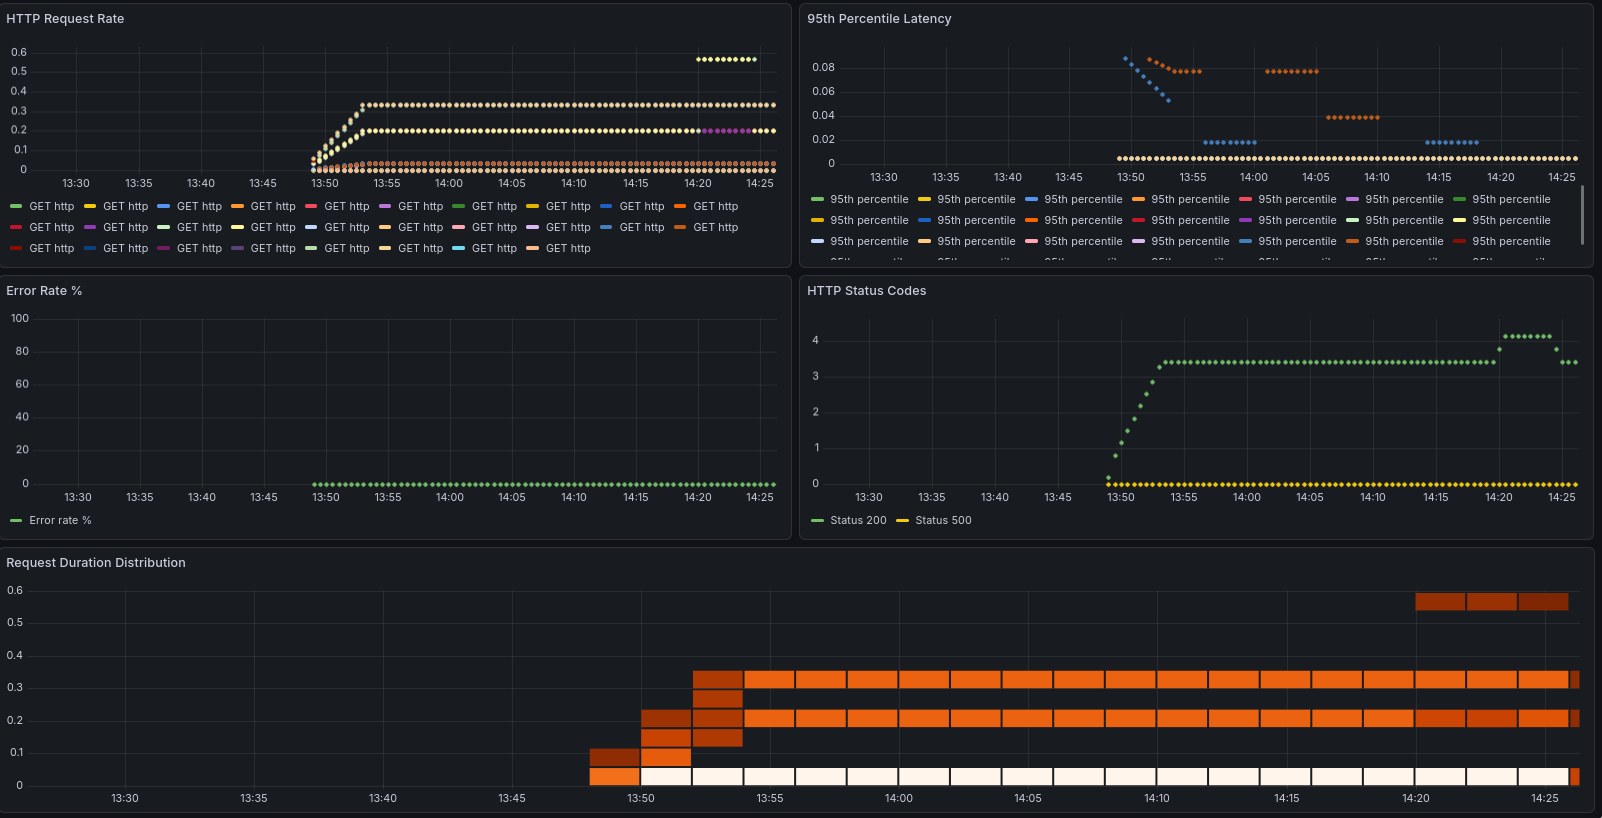
"title": "HTTP Request Rate",
"type": "graph",
"gridPos": {"h": 8, "w": 12, "x": 0, "y": 0},
"targets": [{
"expr": "rate(http_requests_total[5m])",
"legendFormat": "{{method}} {{endpoint}}"
}]
},
{
"id": 2,
"title": "95th Percentile Latency",
"type": "graph",
"gridPos": {"h": 8, "w": 12, "x": 12, "y": 0},
"targets": [{
"expr": "histogram_quantile(0.95, rate(http_request_duration_seconds_bucket[5m]))",
"legendFormat": "95th percentile"
}]
},
{
"id": 3,
"title": "Error Rate %",
"type": "graph",
"gridPos": {"h": 8, "w": 12, "x": 0, "y": 8},
"targets": [{
"expr": "sum(rate(http_requests_total{status=~\"5..\"}[5m])) / sum(rate(http_requests_total[5m]))
* 100",
"legendFormat": "Error rate %"
}]
},
{
"id": 4,
"title": "HTTP Status Codes",
"type": "graph",
"gridPos": {"h": 8, "w": 12, "x": 12, "y": 8},
"targets": [{
"expr": "sum(rate(http_requests_total[5m])) by (status)",
"legendFormat": "Status {{status}}"
}]
},
{
"id": 5,
"title": "Request Duration Distribution",
"type": "heatmap",
"gridPos": {"h": 8, "w": 24, "x": 0, "y": 16},
"targets": [{
"expr": "rate(http_request_duration_seconds_bucket[5m])",
"legendFormat": "{{le}}"
}]
}
],
"time": {
"from": "now-1h",
"to": "now"
},
"refresh": "30s"
}
}
Save it as dashboard.json and upload it to Grafana making use of the API:
kubectl port-forward -n monitoring svc/prometheus-grafana 3000:80 &

curl -X POST https://admin:<password>@localhost:3000/api/dashboards/db \
 -H "Content-Type: application/json" \
 -d @dashboard.json
Login to your Grafana instance (and if you don’t have your instance running locally, just open an ssh tunnel with ssh -L 3000:localhost:3000 -N <ssh host>, which will allow you to open it your web browser by accessing localhost:3000 - pretty handy trick if you ask me!), and watch your dashboards getting filled. In this example, you can clearly see when I decided to hammer one of the endpoints to see if it would get captured by our metrics, and it did!
Loki and alerts#
The last piece of this puzzle is going to be Loki, which will allow us to aggregate logs, which is a fundamental thing when you have so many pieces working together. Like we’ve done in the past, we start by creating a manifest with the configuration values, and apply them to an helm chart. So, we create a loki.yaml file with the following contents:
loki:
  persistence:
    enabled: true
    size: 5Gi
  auth_enabled: false
promtail:
  enabled: true
  config:
    clients:
    - url: http://loki:3100/loki/api/v1/push
grafana:
  enabled: false
And we then apply the helm chart with the following commands:
helm repo add grafana https://grafana.github.io/helm-charts
helm repo update
helm install loki grafana/loki-stack \
  -n monitoring \
  -f loki.yaml
With the logcli application, we can then query all the namespaces at once: logcli query '{app="gitops-demo"}' --tail is a godsend if you need to watch what’s happening in your cluster in real-time.
And to finish it off, we create some alerting rules for our cluster, in a file called monitoring/alerts.yaml:
apiVersion: monitoring.coreos.com/v1
kind: PrometheusRule
metadata:
  name: gitops-demo-alerts
  namespace: monitoring
  labels:
    release: prometheus
    prometheus: kube-prometheus
    role: alert-rules
spec:
  groups:
  - name: gitops-demo.rules
    interval: 30s
    rules:
    - alert: HighErrorRate
      expr: rate(http_requests_total{status=~"5.."}[5m]) > 0.1
      for: 2m
      labels:
        severity: warning
        environment: dev
      annotations:
        summary: "High error rate detected in {{ $labels.namespace }}"
        description: "Error rate is {{ $value }} errors/sec"

    - alert: PodNotReady
      expr: kube_pod_status_ready{condition="true"} == 0
      for: 5m
      labels:
        severity: critical
      annotations:
        summary: "Pod {{ $labels.pod }} is not ready"

    - alert: HighMemoryUsage
      expr: (container_memory_working_set_bytes / container_spec_memory_limit_bytes) > 0.8
      for: 5m
      labels:
        severity: warning
      annotations:
        summary: "High memory usage in {{ $labels.pod }}"
We can check if the rules were applied successfully by querying the Prometheus API using curl: curl -s 'http://localhost:9090/api/v1/rules' | jq '.data.groups[] | select(.name=="gitops-demo.rules")' should return all the alerting rules that are applied to our cluster. And with this, we can proclaim victory and say we have a reasonably complete working system!
Final thoughts and considerations#
This is one hell of a learning experience, that’s for sure. While I’ve had my CKA for a while, there’s nothing like getting your hands dirty and actually building things. To finish it off, here’s some considerations that I collected during this project:
-
Using Cilium was complete overkill for this project; the reason why I chose to implement it as the ingress was that when I started this project, the K8s devs had just announced the deprecation of
nginx-ingress, and you can read about their reasoning here. I thought this would be a great opportunity to try something else, and Cilium seems to be the most natural choice.But it does introduce an extra layer of complexity, especially since we worked with K3s, which already brings an ingress and load balancer to the table. -
Implementing webhooks on Argo CD would certainly be the next step on my list, given that the default polling strategy leaves a bit to be desired. This would be a simple improvement that would greatly improve the velocity and seamlessness of our pipeline.
-
Using k9s is such a QoL improvement when dealing with even a relatively simple architecture like the one we built. Even though we only have a bit over 30 pods running across less than 10 namespaces, this really improved our visibility into what was happening with our clusters at all time. Can thoroughly recommend it to every single K8s admin, either amateur or pro.
-
Last but not least, we used k3s so simplify the deployment of our cluster, but this did introduce some friction in the configuration. I’m not against tools that take care of the abstractions, but this always comes at a cost, and we did have to battle some kinks - this is visible in the fact that we have to configure it with quite some options, and in effect it’s working pretty much as vanilla K8s cluster. Something to keep in mind.
This does conclude our project of building a completely self hosted GitOps pipeline - and I can proudly say that the objective was achieved in full. Hope that you’ve enjoyed taking this ride with me!