Gopromtui - a TUI for displaying Prometheus dashboards
While I’m no stranger to building dashboards, there was always something that bothered me when I was using Grafana for displaying the metrics I wanted to look at: it was a web app! Now, while web apps are much maligned, they do serve a purpose. But for the purpose of displaying rather the rather simple information that Prometheus collect (yes, simple: a complex metric is a useless metric IMO), a web app seems overkill. And now that TUIs are back en vogue, I thought it could be a fun exercise to build a TUI for displaying Prometheus metrics. Hence, gopromtui: a lightweight, terminal-native solution for displaying Prometheus metrics without any additional infrastructure.
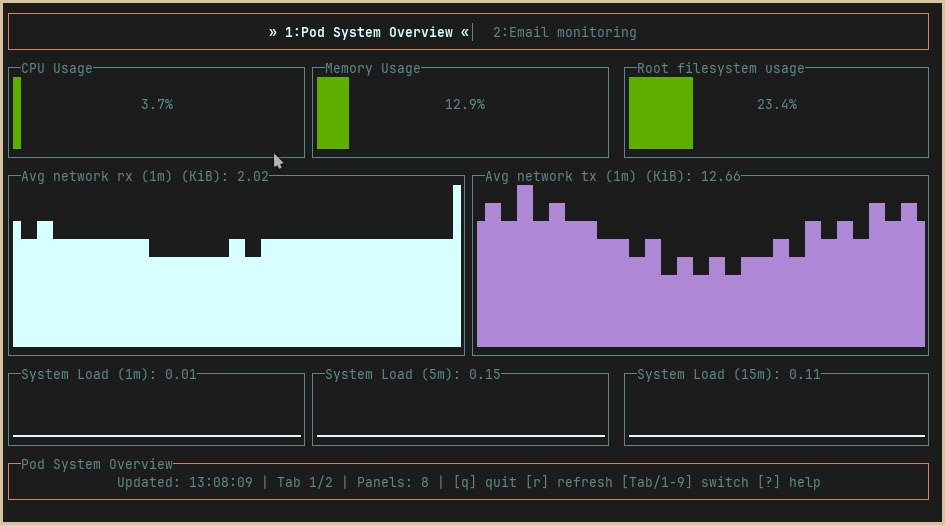
Gopromtui is built upon five pillars:
- Multi-Dashboard Support: Configure multiple dashboards and switch between them with keyboard navigation
- Four Widget Types: Gauge (single values with color-coded thresholds), Chart (time-series line plots), Sparkline (compact trends), and Table (tabular metric data)
- Real-time Updates: Configurable auto-refresh intervals per dashboard (default: 5 seconds)
- Responsive Layout: Percentage-based positioning that adapts to any terminal size
- Keyboard-Driven Interface: Full navigation without mouse dependency
This, I think, makes it shine in situations where you’re either constrained for resources and/or you don’t want to expose your metrics to the web.
The architecture#
One of the things I wanted to the most was to continue to develop applications that require the minimum amount of external dependencies. I had already made this choice when I started coding for gok8ctl, and I was quite happy with the result, so I decided to follow the same philosophy here. This time around, there’s two external dependencies: once again, the yaml processing is handled by go-yaml; as for the TUI, since building an interface was out of scope, I ended up relying on go-tui since it’s a fork of termui (really good lib, but seemingly abandoned at the point), and comes with all the widgets we need for a dashboard already built-in.
The design of the app isn’t that much dissimilar to what I did for gok8ctl, as we have a clean architecture that separates concerns: an orchestration layer, a domain layer, and an infrastructure layer, which can thought of like this: we have an app.go file that runs an event loop and handles the application lifecycle; then there’s the config, widgets and dashboard, which constitute the domain layer of the application (and it’s pretty explicit what they do by their names. Finally, there’s the prometheus part which handles the infrastructure layer and is responsible for the connection to the server.
Concurrency and race conditions#
Perhaps the biggest challenge when thinking about this app was to wrap my head around all the concurrent operations that must be handled all at the same time: we have user input, data refreshes, the possibility of terminal resized and widgets re-drawings, and the rendering during data refresh. All of these operations share some form of mutable state, and this creates a fertile ground for race conditions. On the other hand, I also needed to be careful with TOCTOU bugs, as the time between checking and using a value might lead to a bug in this class being introduced.
In any case, the solution for both these problems, in proper idiomatic Golang fashion, is the introduction of a read-write mutex (a RWMutex is a type from the sync package of the stdlib). This allows us to have a write lock, in effect serializing writes, while allowing for concurrent reads, which is a pattern that fits our app quite well: writes happen infrequently, only on user input; while reads happen multiple times per second, with every dashboard rendering.
This pattern, plus atomizing reads with copies of a slice while holding the lock, makes the app much more robust with regards to the challenges that a concurrent design brings to the table. You can see the fixes I’ve made to gopromtui related with this in three different commits: d7324024c7, 1c6ebacc69, and 9ead463670. Finally, another pattern that is also highly beneficial in such an app, is leveraging the context package (again, the standard library to the rescue) to wrap all external calls and guarantee that we can cancel them if the need arises.
As an example of these problems, let’s have a look at the following snippet. Instead of doing it like this:
// VULNERABLE: Race condition between these calls
index := a.getActiveIndex()
count := a.getDashboardCount()
if index < count {
    // Another goroutine could modify activeIndex here!
    dashboard := a.dashboards[index]
}
We read related values atomically, and avoid bugs:
func (a *App) getActiveIndexAndCount() (int, int) {
    a.dashboardMu.RLock()
    defer a.dashboardMu.RUnlock()
    return a.activeIndex, len(a.dashboards)
}

// Usage: atomic read of both values
idx, count := a.getActiveIndexAndCount()
if idx < count {
    // Safe - values are consistent
}
Testing#
Testing is an integral part of development. For this project, I’d like to highlight three parts that guided me while building it.
Table-driven Tests#
These constitute an idiomatic pattern for parameterized testing, and bring a lot of benefits to the table: they are mostly self-documenting, thanks to the name field; they make it very easy to add new cases without code duplication; their execution can be parallelized making use of t.Run(); and finally, there are clear failure messages that show the input and expected versus what actually resulted from the test. Here’s an example of what I mean:
func TestValueFormatting(t *testing.T) {
    tests := []struct {
        name     string
        input    float64
        expected string
    }{
        {"small number", 42.5, "42.50"},
        {"thousands", 1500, "1.50K"},
        {"millions", 2500000, "2.50M"},
        {"billions", 3500000000, "3.50G"},
        {"negative", -100, "-100.00"},
        {"tiny positive", 0.001234, "0.0012"},
        {"zero", 0, "0.00"},
    }

    for _, tt := range tests {
        t.Run(tt.name, func(t *testing.T) {
            result := formatValue(tt.input)
            if result != tt.expected {
                t.Errorf("formatValue(%v) = %q, want %q", tt.input, result, tt.expected)
            }
        })
    }
}
HTTP Mocking#
As this is an app that makes use of network calls (specifically, HTTP requests), the ability to mock an HTTP server without any external dependencies or actual network calls is a godsend and speeds up the development by quite a lot. I’ve created tests that encompass the full request/response cycle, including serialization, with the added bonus of also testing for error conditions. All in all, the HTTP side of the app is covered by an extensive suite that runs fast and deterministically.
func TestPrometheusQuery(t *testing.T) {
    server := httptest.NewServer(http.HandlerFunc(func(w http.ResponseWriter, r *http.Request) {
        // Verify request correctness
        if r.URL.Path != "/api/v1/query" {
            t.Errorf("unexpected path: %s", r.URL.Path)
        }

        query := r.URL.Query().Get("query")
        if query != "up" {
            t.Errorf("unexpected query: %s", query)
        }

        // Return controlled response
        json.NewEncoder(w).Encode(prometheus.QueryResponse{
            Status: "success",
            Data: prometheus.QueryData{
                ResultType: "vector",
                Result: []prometheus.Sample{{
                    Metric: map[string]string{"__name__": "up"},
                    Value:  []any{float64(1700000000), "1"},
                }},
            },
        })
    }))
    defer server.Close()

    client := prometheus.NewClient(server.URL, 5*time.Second)
    result, err := client.Query(context.Background(), "up")

    if err != nil {
        t.Fatalf("unexpected error: %v", err)
    }
    if len(result.Data.Result) != 1 {
        t.Errorf("expected 1 result, got %d", len(result.Data.Result))
    }
}
Edge Case Coverage#
As I designed a responsive app that respects the dimensions of the terminal where the user is running the app, an area where tests are fundamental is the boundary conditions of the widgets and terminal. One example of how I tackled this problem in testing, as to avoid breakage when changes were introduced, can be seen in the following snippet:
func TestDashboardResizeWithZeroDimensions(t *testing.T) {
    dash, _ := dashboard.New(definition)

    // Should not panic with invalid dimensions
    dash.Resize(0, 50, 2, 3)      // Zero width
    dash.Resize(100, 0, 2, 3)     // Zero height
    dash.Resize(100, 50, 100, 100) // Offsets exceed total

    // Should still return valid drawable
    if len(dash.Drawables()) != 1 {
        t.Error("expected drawables even with invalid resize")
    }
}

func TestSparklineWithNaNValues(t *testing.T) {
    s := widgets.NewSparkline(config)

    // Should filter NaN/Inf values without crashing
    samples := []prometheus.Sample{
        {Value: []any{float64(1), "NaN"}},
        {Value: []any{float64(2), "42"}},
        {Value: []any{float64(3), "+Inf"}},
    }

    s.UpdateData(samples)
    // Verify NaN values are filtered
}
Closing Remarks#
After a bit of fiddling and messing around with Prometheus queries and sources, I’m happy with the state of this app. For sure, a lot could still be added, like some other widgets that would better fit some queries. But, as it is, I think it’s in good enough state to share with everyone and collect some feedback! Let me know what you think :-)