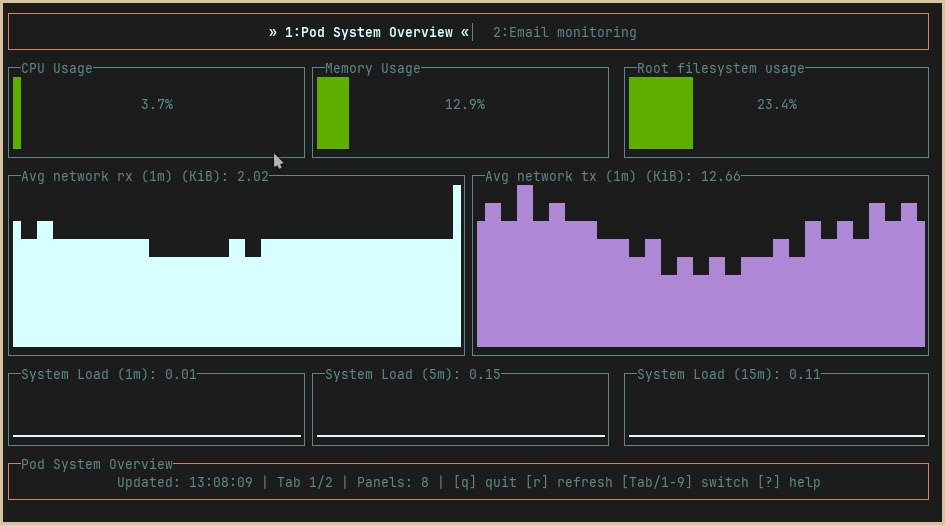
While I’m no stranger to building dashboards, there was always something that bothered me when I was using Grafana for displaying the metrics I wanted to look at: it was a web app! Now, while web apps are much maligned, they do serve a purpose. But for the purpose of displaying rather the rather simple information that Prometheus collect (yes, simple: a complex metric is a useless metric IMO), a web app seems overkill. And now that TUIs are back en vogue, I thought it could be a fun exercise to build a TUI for displaying Prometheus metrics. Hence, gopromtui: a lightweight, terminal-native solution for displaying Prometheus metrics without any additional infrastructure.