Building a GitOps pipeline
Part 1#
This is going to be a series of posts about a learning journey on what it takes to build a GitOps pipeline, with the added constraint that I’m going to be self-hosting all of the necessary parts to achieve this. On one hand, it’s bound to be a great exercise to put together disjointed pieces of knowledge I already had; and on the other, it serves as a way to document the journey for people that might be interested in knowing how such a thing is possible.
So, let’s get started!
The Foundation#
I start this journey by cheating a little: I already had a Gitea instance running. Now, this is hardly the most challenging part of this journey, as the set-up of Gitea is relatively straight-forward. The reason why I chose Gitea is due to the fact that it’s a FOSS project with built-in Actions support that are mostly compatible with Github Actions: this will make the iteration process faster, as there’s a lot more documentation available about GHAs, and the fact that it’s tightly integrated with the forge. There’s also the added benefit that a container registry available, which is important in several situations.
This is the first piece of the puzzle. The other is a demo app that I built in Go for this purpose, and allows me to demonstrate several principles that are essential in a CI/CD framework. Go makes it easy to make testing and vetting first class citizens of this process, as well as easily expose endpoints that will become fundamental later on.
The App#
You can see the full source code of the app here. Of note, we expose two endpoints that just return very simple information:
func healthHandler(w http.ResponseWriter, r *http.Request) {
    json.NewEncoder(w).Encode(map[string]any{
        "status":    "healthy",
        "timestamp": time.Now().Unix(),
    })
}

func readinessHandler(w http.ResponseWriter, r *http.Request) {
    if !probeState.ready.Load() {
        http.Error(w, `{"error": "Readiness probe failed"}`, http.StatusInternalServerError)
        return
    }
    json.NewEncoder(w).Encode(map[string]string{"status": "ready"})
}
Of note, there’s the fact that we can build this with just Go’s standard library. As it is, there’s no external dependencies, which is something I like a lot about Go for mocking these simple apps. This pattern repeats once we have get to the testing: we can query the endpoint with nothing but the standard library:
func TestHealthHandler(t *testing.T) {
    req := httptest.NewRequest("GET", "/health", nil)
    w := httptest.NewRecorder()

    healthHandler(w, req)

    if w.Code != http.StatusOK {
        t.Errorf("Expected status 200, got %d", w.Code)
    }

    if w.Body.String() == "" {
        t.Error("Expected non-empty response body")
    }
}
With this out of the way, we can start to build the pipeline.
The Pipeline#
There’s two parts here: the Dockerfile, and the workflow for the CI action. Starting with the first, it’s again a simple set of instructions to build our app. The only thing of note here is the choice of the alpine images, as they provide a minimal starting point which reduces the bloat included in the process.
FROM golang:1.25-alpine AS builder

WORKDIR /app

COPY go.mod ./
RUN go mod download

COPY *.go ./
RUN go build -o gitops-demo .

FROM alpine:latest

RUN addgroup -g 1000 gitops && adduser -D -u 100 -G gitops gitops

WORKDIR /app

COPY --from=builder /app/gitops-demo .
RUN chown -R gitops:gitops /app

USER gitops

EXPOSE 8080

CMD ["./gitops-demo"]
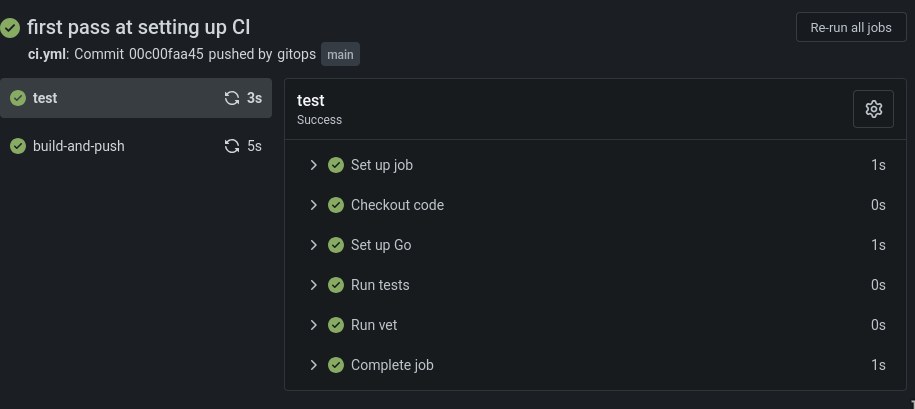
As for the workflow, it’s slightly more complex, but only because we’re doing much more: first, we setup the testing phase, which is fundamental to guarantee that no code gets integrated that doesn’t pass our testing suite. You should still run the tests locally, but this adds a safety layer to the project. Once the testing phase passes, we go to the building phase: we build the binary, and we build and push the Docker images to the container registry that Gitea makes available - you can find the latest images here.
name: CI

on:
  push:
    branches: [main]

env:
  REGISTRY_HOST: git.assilvestrar.club

jobs:
  test:
    runs-on: self-hosted
    steps:
    - name: Checkout code
      uses: actions/checkout@v4

    - name: Set up Go
      uses: actions/setup-go@v4
      with:
        go-version: '1.24'

    - name: Run tests
      run: go test -v ./...

    - name: Run vet
      run: go vet ./...

  build-and-push:
    needs: test
    runs-on: self-hosted
    if: github.ref == 'refs/heads/main'
    steps:
    - uses: actions/checkout@v4

    - name: Set up Go
      uses: actions/setup-go@v4
      with:
        go-version: '1.24'

    - name: Build binary
      run: go build -v ./...

    - name: Build and push Docker image
      run: |
        docker build -t ${REGISTRY_HOST}/${{ secrets.REGISTRY_USER }}/gitops-demo-app:${{ github.sha }} .
        docker tag ${REGISTRY_HOST}/${{ secrets.REGISTRY_USER }}/gitops-demo-app:${{ github.sha }} ${REGISTRY_HOST}/${{ secrets.REGISTRY_USER }}/gitops-demo-app:latest
        echo ${{ secrets.REGISTRY_PASS }} | docker login ${REGISTRY_HOST} -u ${{ secrets.REGISTRY_USER }} --password-stdin
        docker push ${REGISTRY_HOST}/${{ secrets.REGISTRY_USER }}/gitops-demo-app:${{ github.sha }}
        docker push ${REGISTRY_HOST}/${{ secrets.REGISTRY_USER }}/gitops-demo-app:latest
      working-directory: .
Of note, there’s the secrets.REGISTRY_USER and secrets.REGISTRY_PASS variables. These are secrets that are hosted on Gitea, which adds a layer of security to this workflow: this way, we’re not exposing credentials online, and I don’t need to tell you how important this is.
Now we have all the pieces we need! We push all this to our Gitea repository, et voilà! Is there a prettier sight than all these green check marks?
Now that we have a very simple CI pipeline established, we can start to expand it with some other niceties. The fact that the endpoints I started with are called health and ready should offer some clues. But, first, we will start by making this infrastructure a bit more realistic for real-life scenarios.
Part 2#
The next step is to start building our infrastructure. For that, I will be using a few tools, namely: building a Kubernetes cluster, harnessing the power of k3s and kustomize, both of which greatly simplify the creation and configuration of the cluster and the different environments; and Argo CD as our continuous delivery tool that’s k8s native. All of this, of course, will be greatly enhanced by our already existing Git forge, and all the configuration files used are made available on the gitops-demo-config repository - this wouldn’t be a GitOps pipeline otherwise.
k3s and cilium#
Spinning up the cluster with k3s is as easy as a issuing a single command. But before that, I recommend exporting a simple variable that’s bound to save you some headaches: export KUBECONFIG=~/.kube/config. Ideally this will live in your .bashrc (or equivalent), and its purpose is to tell all k8s native applications where the configuration is being kept. Once that’s done, we’re set for the creation of the cluster:
k3s server --flannel-backend none --disable-network-policy
Of note here is the 2 args we pass tell k3s that we don’t want it to manage the CNI, as we’re going to install Cilium for that purpose. That’s also relatively simple, with the help of the helm chart that is made available by the project:
helm repo add cilium https://helm.cilium.io && helm install cilium cilium/cilium --namespace kube-system --set kubeProxyReplacement=true
With the help of kubectl cluster-info and kubectl get nodes -n kube-system, we should eventually see that both our cluster and Cilium are now up and ready. Great! Finally, feel free to make the configuration of k3s permanent by adding the following options to the /etc/rancher/k3s/config.yaml file:
flannel-backend: "none"
disable-kube-proxy: true
disable-network-policy: true
cluster-init: true
disable:
  - servicelb
  - traefik
We also need to add a few more options to Cilium, so as to guarantee that its ingress will work:
helm upgrade cilium \
    --set cluster.id=1 \
    --set cluster.name=<your-hostname> \
    --set k8sServiceHost=<your-ip> \
    --set k8sServicePort=6443 \
    --set ipam.operator.clusterPoolIPv4PodCIDRList="10.42.0.0/16" \
    --set kubeProxyReplacement=true \
    --helm-set=operator.replicas=1 \
    --set ingressController.enabled=true \
    --set ingressController.loadbalancerMode=shared
This will enable you to make the options permanent, and manage the k3s cluster with ease by using systemd with the systemctl start/stop k3s.service command.
Setting up the repository#
We can now set up the git repository where our configuration files will live. We start by laying out a simple structure, like so:
gitops-demo-config/
├── base/
│   ├── deployment.yaml
│   ├── service.yaml
│   ├── configmap.yaml
│   └── kustomization.yaml
└── environments/
    ├── dev/
    │   └── kustomization.yaml
    ├── staging/
    │   └── kustomization.yaml
    └── prod/
       └── kustomization.yaml
The base layer is where the common information will live. The configmap holds the configurations for the app we want to deploy; the service helps with mapping the networking information; the deployment ties them all together, as well as giving some defaults for the resources used by each container. Finally, there’s the kustomization files: the one that lives at the base layer gives us the defaults for each environment; while then we can patch and change each different environment for more fine-grained control over them (compare the ones for the dev, staging and prod environments).
With the manifests in place, we can start by validating the files. In the gitops-demo-config directory, issuing the command kubectl kustomize base | yq is bound to be a great help here. The second step would be a simple bash script:
for env in dev staging prod; do
  echo "=== $env environment ==="
  kubectl kustomize environments/$env | kubectl apply --dry-run=client -f -
done
If all went well, this is when we start to create and deploy our infra:
  kubectl create namespace dev
  kubectl create namespace staging
  kubectl create namespace prod

  kubectl apply -k environments/dev
  kubectl rollout status deployment/gitops-demo-dev -n dev --timeout=300s
  kubectl get pods -n dev
And we test all of this by probing our app:
kubectl port-forward -n dev svc/gitops-demo-dev 8180:80 &
curl http://localhost:8180/health
curl http://localhost:8180/version
If all went well, we should see the following output:
$ ~ curl http://localhost:8180/health
{"status":"healthy","timestamp":1763626390,"version":"latest"}
$ ~ curl http://localhost:8180/version
{"feature_enabled":true,"version":"latest"}
With this, we will go ahead and push all of the changes we did in the gitops-demo-config so that all of our configurations starts to live on git:
git add .
git commit -m "feat: complete K8s manifests with Kustomize"
git push origin main
And so it lives!
Argo CD#
Now it’s time to start assembling the Continuous Deployment part of our GitOps pipeline. Argo CD is my choice for this part, since it fits perfectly into the philosophy of self-hosting, and integrates with the architecture that we have assembled so far. We start by creating a namespace for it, and installing it there.
kubectl create namespace argocd
kubectl apply -n argocd -f https://raw.githubusercontent.com/argoproj/argo-cd/stable/manifests/install.yaml
kubectl wait --for=condition=ready pod -l app.kubernetes.io/name=argocd-server -n argocd --timeout=600s
Let us configure access to Argo CD, so that we can apply changes to it and see the deployments taking place from the argocd CLI interface:
kubectl -n argocd get secret argocd-initial-admin-secret -o jsonpath="{.data.password}" | base64 -d

kubectl port-forward svc/argocd-server -n argocd 8081:443 &

argocd login localhost:8081 --insecure --username admin --password <password>
argocd account update-password --current-password <password> --new-password <new_password>
And finally, we add our Gitea repository with the configuration files to Argo CD, so that it knows where to fetch the information for the management of the infrastructure. Here it’s important to note something: the best practice is to create an API token in Gitea to give access to Argo CD. Create and execute the script below. After this, you can check the status of the repo by using the argocd repo list command.
#!/bin/bash
kubectl apply -f - <<EOF
 apiVersion: v1
 kind: Secret
 metadata:
   name: gitea-repo
   namespace: argocd
   labels:
     argocd.argoproj.io/secret-type: repository
 stringData:
   url: https://git.assilvestrar.club/gitops/gitops-demo-config.git
   username: gitops
   password: YOUR_GITEA_PASSWORD_OR_TOKEN
EOF
We can now create the project, where we specify what environments we want Argo CD to manage. This time around, the command to check the results of this setup is argocd proj list:
argocd proj create gitops-demo \
  --description "GitOps Demo Project" \
  --dest https://kubernetes.default.svc,dev \
  --dest https://kubernetes.default.svc,staging \
  --dest https://kubernetes.default.svc,prod \
  --src https://git.assilvestrar.club/gitops/gitops-demo-config.git
And with that out of the way, we can now enter the last step of setting up Argo CD: we create the directory structure in our gitops-demo-config repository, so that the manifest for each environment we manage with it can have a place to live with proper version control. This is the new directory structure:
gitops-demo-config/
├── base/
│   ├── deployment.yaml
│   ├── service.yaml
│   ├── configmap.yaml
│   └── kustomization.yaml
├── environments/
│   ├── dev/
│   │   └── kustomization.yaml
│   ├── staging/
│   │   └── kustomization.yaml
│   └── prod/
│       └── kustomization.yaml
└── argocd-apps/
    ├── dev.yaml
    ├── staging.yaml
    └── prod.yaml
Feel free to check the respective manifest files for each environment: dev, staging, and prod. As you can see, they’re all pretty similar, but the level of control you have over them is quite big, which is a big boon if, say, you want your prod environments to not self-heal (not that you should do it, but you get the idea).
We then have to apply the manifests we just created by using the kubectl apply -f argocd-apps/ command, and seeing it all apply with watch -n 2 'argocd app list'. If you see that everything is at it should be, it’s time to push them into your git repo.
Now, for the best part: let’s actually change something in our configuration, and check if everything is working in tandem. Say that you want to increase the replicas in your dev environment from 1 to 2. In the environments/dev/kustomization.yaml file, the replicas[0].count field can be changed to reflect that. You save your changes and commit them to git:
git add .
git commit -m "test: scalling dev to 2 replicas"
git push
If you check the output of kubectl get pods -n dev you should now see that this namespace now has two replicas of your app living side-by-side, instead of just one:
$ kubectl get pods -n dev
NAME                              READY   STATUS    RESTARTS      AGE
gitops-demo-dev-b64df69d9-l89g9   1/1     Running   0             13h
gitops-demo-dev-b64df69d9-z9l7z   1/1     Running   1 (44m ago)   17h
Congratulations, you now have a version controlled, declarative, continuous deployment pipeline!
We now have both a CI and CD pipeline that’s fully managed by configuration files that live in your git forge. Next up, we will be adding some observability and reliability tools to our infrastructure.
Part 3#
After installing and setting up all the different pieces of our CI/CD pipeline, we still need to do a bit of work to make sure that this process is as automated as possible, as is working in tandem to our benefit. This part is mostly about that.
Ingress and SSL#
Even though cilium was installed in our system, we still need to configure the different environments to use it as its ingress, as well as configuring a load balancer and certificate manager. Thankfully these are all relatively straight-forward tasks. Let us start with the load balancer, which is going to be metallb. This is achieved by installing the following manifest: kubectl apply -f https://raw.githubusercontent.com/metallb/metallb/v0.15.2/config/manifests/metallb-native.yaml. Feel free to download it beforehand to double check its contents. After that is done and all the pods and services are up and running, we create the file metallb-config.yaml with the following contents:
apiVersion: metallb.io/v1beta1
kind: IPAddressPool
metadata:
  name: first-pool
  namespace: metallb-system
spec:
  addresses:
  - ---------  # Your server's IP
---
apiVersion: metallb.io/v1beta1
kind: L2Advertisement
metadata:
  name: l2-advert
  namespace: metallb-system
spec:
  ipAddressPools:
  - first-pool
Which we then add to our cluster by running kubectl apply -f metallb-config.yaml. With this out of the way, we can start to configure cert-manager, which is again as simple as installing it and issuing a simple configuration file:
  helm repo add jetstack https://charts.jetstack.io
  helm repo update

  helm install cert-manager jetstack/cert-manager \
    -n cert-manager \
    --create-namespace \
    --set installCRDs=true

  kubectl wait --for=condition=ready pod -l app.kubernetes.io/name=cert-manager -n cert-manager --timeout=300s
We then create the file cluster-issuer.yaml which will instruct cert-manager to issue self-signed certificates:
apiVersion: cert-manager.io/v1
kind: ClusterIssuer
metadata:
  name: selfsigned-issuer
spec:
  selfSigned: {}
And issue a kubectl apply -f cluster-issuer.yaml command. Which, at this points, leads us to create the certificate.yaml files for each of our environments. You can check the exact files for dev, staging, and prod, but they’re all of the following form:
apiVersion: cert-manager.io/v1
kind: Certificate
metadata:
  name: gitops-demo-prod-tls
spec:
  secretName: gitops-demo-prod-tls
  issuerRef:
    name: selfsigned-issuer
    kind: ClusterIssuer
  dnsNames:
  - prod.gitops-demo.local
Finally, it’s time to configure the ingress files for each environment. Again, each environment is slightly different (check: dev, staging, prod), but they’re all similar:
apiVersion: networking.k8s.io/v1
kind: Ingress
metadata:
  name: gitops-demo
  namespace: prod
  annotations:
    cert-manager.io/cluster-issuer: selfsigned-issuer
spec:
  ingressClassName: cilium
  tls:
  - hosts:
    - prod.gitops-demo.local
    secretName: gitops-demo-prod-tls
  rules:
  - host: prod.gitops-demo.local
    http:
      paths:
      - path: /
        pathType: Prefix
        backend:
          service:
            name: gitops-demo-prod
            port:
              number: 80
One last part: you need to add the following line to your /etc/hosts so that DNS resolution works:
<your-ip> dev.gitops-demo.local staging.gitops-demo.local prod.gitops-demo.local
You can now apply all the changes to the environments by using kubectl:
kubectl apply -k environments/{dev,staging,prod}
And that’s it! With a simple curl -k https://dev.gitops-demo.local/version (note the -k argument), you should see the expected results! That was easy, no?
Automating the CI/CD pipeline#
It’s true that with Argo CD, we have a pipeline for continuous deployment. But as it is, our current CI system isn’t able to actually deploy anything. For this, we need to change our workflow, by adding new steps to it. We will adopt a conservative strategy: for dev, we want to deploy straight away our changes, as that’s where we wish to see our changes reflected the soonest. For staging and prod, we will have another strategy: push the changes to a new branch, and create a pull request for merging with the main branch, which is the one that Argo CD watches. Let’s see:
Pushing to dev#
First, and most importantly, we need a small change to the kustomize.yaml in each of the environments. We will opt to use a patch strategy to guarantee that Argo CD picks up the changes that we will push to the environments. For that, we need to add the following section under the patches spec that was already present in the files:
- target:
    kind: Deployment
    name: gitops-demo
  patch: |
    - op: replace
      path: /spec/template/spec/containers/0/image
      value: "git.assilvestrar.club/gitops/gitops-demo-app:latest"
With this change, we can now add the first part of our workflow change, responsible to pushing changes to the git repository. In the .gitea/workflows/ci.yaml file in our gitops-demo-app repo, we need to add the first part of the automation job:
  update-config:
    needs: build-and-push
    runs-on: self-hosted
    if: github.ref == 'refs/heads/main'
    steps:
    - uses: actions/checkout@v4

    - name: Update dev environment
      run: |
        git clone https://${{ secrets.REGISTRY_USER }}:${{ secrets.REGISTRY_PASS }}@${REGISTRY_HOST}/${{ secrets.REGISTRY_USER }}/gitops-demo-config.git config-repo
        cd config-repo
        yq e '.patches[1].patch = "- op: replace\n  path: /spec/template/spec/containers/0/image\n  value: \"git.assilvestrar.club/gitops/gitops-demo-app:'${{ github.sha }}'\""' -i environments/dev/kustomization.yaml
        git config --global user.email "ci@gitops.local"
        git config --global user.name "CI Bot"
        git add environments/dev/kustomization.yaml
        git commit -m "ci: update dev image to ${{ github.sha }}"
        git push https://${{ secrets.REGISTRY_USER }}:${{ secrets.REGISTRY_PASS }}@${REGISTRY_HOST}/${{ secrets.REGISTRY_USER }}/gitops-demo-config.git main
What this does is that once the build was successful and the new image is pushed to the docker registry we are hosting, we then proceed to patch the kustomization.yaml file for the dev environment (hence the yq tool being used there - it’s a lifesaver to make sure yaml is properly formatted). We then proceed to straight away push this change to the git repository’s main branch. Which means that Argo CD will then pick up this change and apply it to the containers in your cluster. Pretty cool, we actually have automatic deployments to the dev environment by now.
Managing staging and prod#
As mentioned before, the strategy for merging on staging and prod ought to be a bit different, as we don’t want automatic deployment of the new version of an image; we wish to vet the new image in a dev environment, and only then promote said image to staging, and eventually prod. With this in mind, we adopt a different strategy: first, we create a separate branch for each of staging and prod, and there we commit the changes that would bring the environment to the new image. At the same time, we create a pull request to make it easy to merge those changes once the time is right. With this in mind, the actual code that manages this workflow is as follows:
  create-staging-pr:
    needs: update-config
    runs-on: self-hosted
    if: github.ref == 'refs/heads/main'
    steps:
    - uses: actions/checkout@v4

    - name: Create staging promotion PR
      run: |
        git clone https://${{ secrets.REGISTRY_USER }}:${{ secrets.REGISTRY_PASS }}@${REGISTRY_HOST}/${{ secrets.REGISTRY_USER }}/gitops-demo-config.git config-repo
        cd config-repo
        git switch -c promote/${{ github.sha }}-to-staging
        yq e '.patches[1].patch = "- op: replace\n  path: /spec/template/spec/containers/0/image\n  value: \"git.assilvestrar.club/gitops/gitops-demo-app:'${{ github.sha }}'\""' -i environments/staging/kustomization.yaml
        git config --global user.email "ci@gitops.local"
        git config --global user.name "CI Bot"
        git add environments/staging/kustomization.yaml
        git commit -m "ci: promote ${{ github.sha }} to staging"
        git push https://${{ secrets.REGISTRY_USER }}:${{ secrets.REGISTRY_PASS }}@${REGISTRY_HOST}/${{ secrets.REGISTRY_USER }}/gitops-demo-config.git promote/${{ github.sha }}-to-staging
        curl -v -X POST https://${REGISTRY_HOST}/api/v1/repos/${{ secrets.REGISTRY_USER }}/gitops-demo-config/pulls -H "Authorization: token ${{ secrets.REGISTRY_PASS }}" -H "Content-Type: application/json" -d '{"title":"Promote ${{ github.sha }} to staging","head":"promote/${{ github.sha }}-to-staging","base":"main"}'

  create-prod-pr:
    needs: update-config
    runs-on: self-hosted
    if: github.ref == 'refs/heads/main'
    steps:
    - uses: actions/checkout@v4

    - name: Create prod promotion PR
      run: |
        git clone https://${{ secrets.REGISTRY_USER }}:${{ secrets.REGISTRY_PASS }}@${REGISTRY_HOST}/${{ secrets.REGISTRY_USER }}/gitops-demo-config.git config-repo
        cd config-repo
        git switch -c promote/${{ github.sha }}-to-prod
        yq e '.patches[1].patch = "- op: replace\n  path: /spec/template/spec/containers/0/image\n  value: \"git.assilvestrar.club/gitops/gitops-demo-app:'${{ github.sha }}'\""' -i environments/prod/kustomization.yaml
        git config --global user.email "ci@gitops.local"
        git config --global user.name "CI Bot"
        git add environments/prod/kustomization.yaml
        git commit -m "ci: promote ${{ github.sha }} to prod"
        git push https://${{ secrets.REGISTRY_USER }}:${{ secrets.REGISTRY_PASS }}@${REGISTRY_HOST}/${{ secrets.REGISTRY_USER }}/gitops-demo-config.git promote/${{ github.sha }}-to-prod
        curl -v -X POST https://${REGISTRY_HOST}/api/v1/repos/${{ secrets.REGISTRY_USER }}/gitops-demo-config/pulls -H "Authorization: token ${{ secrets.REGISTRY_PASS }}" -H "Content-Type: application/json" -d '{"title":"Promote ${{ github.sha }} to prod","head":"promote/${{ github.sha }}-to-prod","base":"main"}'
You can see that both the create-staging-pr and create-prod-pr are pretty much similar, with the only difference being the branches where they are pushing the changes needed. We finish everything off by creating a pull request on main, and you can see how that looks here: pr for staging and pr for prod. And now we have a pretty much automated CI/CD pipeline!
Part 4#
We’ve now arrived at the last stretch of this journey. As mentioned in the previous post, we will now try and establish some ways to increase the visibility on what’s happening in our cluster. This will imply two things: on one hand, we will improve the app that was built for this project, with the objective of imbuing it with an integration to an event monitoring system; and then we will build the event monitoring system itself.
Improving the backend#
We’re got to admit that we’re somewhat lucky, in that Golang is the perfect choice for building the kind of app we wanted: with a very simple logic, we’re able to integrate Prometheus into what we already have. So much so, that very little of what we already built is going to be changed (there’s only a single exception to this), with most of the work is about adding simple observability code by leveraging the existing prometheus Go client.
The single change we did was changing the handler function, that now looks like this:
func withMetrics(next http.Handler) http.HandlerFunc {
	return func(w http.ResponseWriter, r *http.Request) {
		start := time.Now()
		wrapped := &responseWriter{ResponseWriter: w, statusCode: http.StatusOK}
		next.ServeHTTP(wrapped, r)
		duration := time.Since(start).Seconds()
		requestCount.WithLabelValues(r.Method, r.URL.Path, strconv.Itoa(wrapped.statusCode)).Inc()
		requestDuration.WithLabelValues(r.Method, r.URL.Path).Observe(duration)
	}
}
This middleware, which takes an http.Handler as an argument, returns a function that starts by registering the time when the request starts processing, captures the HTTP status code by making use of the wrapped variable (which was instantiated as a custom responseWriter struct), collects the duration of the request processing time, and finally increments the requestCount count and introduces a new data point on the requestDuration histogram that live in Prometheus. These last two variables are part of the code that was newly introduced in this version of the app, and are rather simple to understand:
var (
	requestCount = prometheus.NewCounterVec(
		prometheus.CounterOpts{
			Name: "http_requests_total",
			Help: "Total number of HTTP requests",
		},
		[]string{"method", "endpoint", "status"},
	)
	requestDuration = prometheus.NewHistogramVec(
		prometheus.HistogramOpts{
			Name: "http_request_duration_seconds",
			Help: "HTTP request duration (in s)",
		},
		[]string{"method", "endpoint"},
	)
)
The rest of the changes are mostly related with boilerplate for Prometheus, and adding new endpoints for testing. You can see the full diff of the changes over in the git repository where the app lives. With this in place, and with the new version of the app deployed in our cluster (remember, we now have automated deployments!), it’s time to go for the installation of Prometheus and co.
Monitoring and logging#
Prometheus and Grafana#
By now, everyone is pretty much familiarized with this stack. We use Prometheus for collecting metrics that interest us, Grafana for displaying dashboards with those metrics, and Loki for having a bit more insight into what’s happening inside our cluster. Let us start by installing and configuring Prometheus. This is easy making use of an helm chart and a pretty standard prometheus-values.yaml file:
grafana:
  adminPassword: --- # add your password here
  persistence:
    enabled: true
    size: 5Gi
  ingress:
    enabled: true
    ingressClassName: cilium
    hosts:
    - grafana.gitops-demo.local
prometheus:
  prometheusSpec:
    retention: 7d
    serviceMonitorSelector:
      matchLabels: {}  # Watch all ServiceMonitors regardless of labels
    serviceMonitorNamespaceSelector:
      matchLabels: {}  # Watch ServiceMonitors in all namespaces
    storageSpec:
      volumeClaimTemplate:
        spec:
          accessModes: ["ReadWriteOnce"]
          resources:
            requests:
              storage: 10Gi
alertmanager:
  enabled: true
  ingress:
    enabled: true
    ingressClassName: cilium
    hosts:
    - alerts.gitops-demo.local
With this in place, we can install both Prometheus and Grafana all at once with the handy helm chart:
helm repo add prometheus-community https://prometheus-community.github.io/helm-charts
helm repo update
helm install prometheus prometheus-community/kube-prometheus-stack \
  -n monitoring \
  --create-namespace \
  -f prometheus-values.yaml
This is bound to take a few minutes, which is there the kubectl wait --for=condition=ready pod -l release=prometheus -n monitoring --timeout=600s comes in really handy. After everything is running, it’s also time to add another line to /etc/hosts, so that we have DNS resolution: <your-ip> grafana.gitops-demo.local alerts.gitops-demo.local. After that’s out of the way, we will need another manifest for ServiceMontior:
apiVersion: monitoring.coreos.com/v1
kind: ServiceMonitor
metadata:
  name: gitops-demo
  labels:
    app: gitops-demo
spec:
  selector:
    matchLabels:
      app: gitops-demo
  endpoints:
  - port: http
    interval: 30s
    path: /metrics
This servicemontior.yaml file will live in your base directory, so that it’s applied equally across all your environments. Once that’s done, you can apply the changes: kubectl apply -k {dev,staging,prod}. If all went well, we can now start to configure grafana to show us some stats about our app. This is a simple example that shows us the metrics that our app exposes:
{
  "dashboard": {                                                                                                        "id": null,
    "title": "GitOps Demo App Metrics",
    "tags": ["gitops", "prometheus"],
    "timezone": "browser",
    "panels": [
      {
        "id": 1,
        "title": "HTTP Request Rate",
        "type": "graph",
        "gridPos": {"h": 8, "w": 12, "x": 0, "y": 0},
        "targets": [{
          "expr": "rate(http_requests_total[5m])",
          "legendFormat": "{{method}} {{endpoint}}"
        }]
      },
      {
        "id": 2,
        "title": "95th Percentile Latency",
        "type": "graph",
        "gridPos": {"h": 8, "w": 12, "x": 12, "y": 0},
        "targets": [{
          "expr": "histogram_quantile(0.95, rate(http_request_duration_seconds_bucket[5m]))",
          "legendFormat": "95th percentile"
        }]
      },
      {
        "id": 3,
        "title": "Error Rate %",
        "type": "graph",
        "gridPos": {"h": 8, "w": 12, "x": 0, "y": 8},
        "targets": [{
          "expr": "sum(rate(http_requests_total{status=~\"5..\"}[5m])) / sum(rate(http_requests_total[5m]))
* 100",
          "legendFormat": "Error rate %"
        }]
      },
      {
        "id": 4,
        "title": "HTTP Status Codes",
        "type": "graph",
        "gridPos": {"h": 8, "w": 12, "x": 12, "y": 8},
   	              "targets": [{
          "expr": "sum(rate(http_requests_total[5m])) by (status)",
          "legendFormat": "Status {{status}}"
        }]
      },
      {
        "id": 5,
        "title": "Request Duration Distribution",
        "type": "heatmap",
        "gridPos": {"h": 8, "w": 24, "x": 0, "y": 16},
        "targets": [{
          "expr": "rate(http_request_duration_seconds_bucket[5m])",
          "legendFormat": "{{le}}"
        }]
      }
    ],
    "time": {
      "from": "now-1h",
      "to": "now"
    },
    "refresh": "30s"
  }
}
Save it as dashboard.json and upload it to Grafana making use of the API:
kubectl port-forward -n monitoring svc/prometheus-grafana 3000:80 &

curl -X POST https://admin:<password>@localhost:3000/api/dashboards/db \
 -H "Content-Type: application/json" \
 -d @dashboard.json
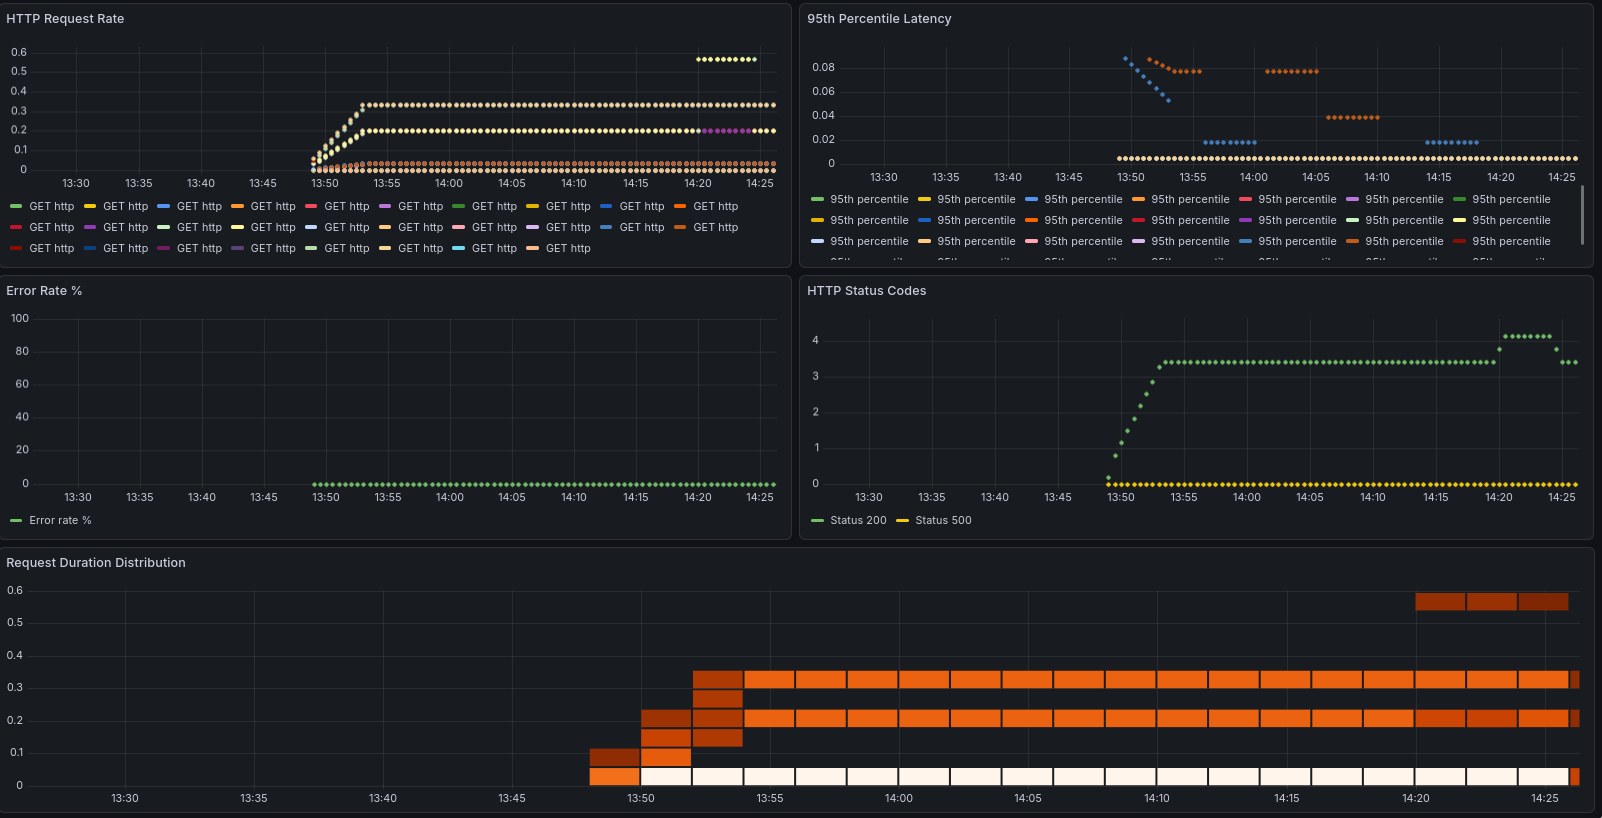
Login to your Grafana instance (and if you don’t have your instance running locally, just open an ssh tunnel with ssh -L 3000:localhost:3000 -N <ssh host>, which will allow you to open it your web browser by accessing localhost:3000 - pretty handy trick if you ask me!), and watch your dashboards getting filled. In this example, you can clearly see when I decided to hammer one of the endpoints to see if it would get captured by our metrics, and it did!
Loki and alerts#
The last piece of this puzzle is going to be Loki, which will allow us to aggregate logs, which is a fundamental thing when you have so many pieces working together. Like we’ve done in the past, we start by creating a manifest with the configuration values, and apply them to an helm chart. So, we create a loki.yaml file with the following contents:
loki:
  persistence:
    enabled: true
    size: 5Gi
  auth_enabled: false
promtail:
  enabled: true
  config:
    clients:
    - url: http://loki:3100/loki/api/v1/push
grafana:
  enabled: false
And we then apply the helm chart with the following commands:
helm repo add grafana https://grafana.github.io/helm-charts
helm repo update
helm install loki grafana/loki-stack \
  -n monitoring \
  -f loki.yaml
With the logcli application, we can then query all the namespaces at once: logcli query '{app="gitops-demo"}' --tail is a godsend if you need to watch what’s happening in your cluster in real-time.
And to finish it off, we create some alerting rules for our cluster, in a file called monitoring/alerts.yaml:
apiVersion: monitoring.coreos.com/v1
kind: PrometheusRule
metadata:
  name: gitops-demo-alerts
  namespace: monitoring
  labels:
    release: prometheus
    prometheus: kube-prometheus
    role: alert-rules
spec:
  groups:
  - name: gitops-demo.rules
    interval: 30s
    rules:
    - alert: HighErrorRate
      expr: rate(http_requests_total{status=~"5.."}[5m]) > 0.1
      for: 2m
      labels:
        severity: warning
        environment: dev
      annotations:
        summary: "High error rate detected in {{ $labels.namespace }}"
        description: "Error rate is {{ $value }} errors/sec"

    - alert: PodNotReady
      expr: kube_pod_status_ready{condition="true"} == 0
      for: 5m
      labels:
        severity: critical
      annotations:
        summary: "Pod {{ $labels.pod }} is not ready"

    - alert: HighMemoryUsage
      expr: (container_memory_working_set_bytes / container_spec_memory_limit_bytes) > 0.8
      for: 5m
      labels:
        severity: warning
      annotations:
        summary: "High memory usage in {{ $labels.pod }}"
We can check if the rules were applied successfully by querying the Prometheus API using curl: curl -s 'http://localhost:9090/api/v1/rules' | jq '.data.groups[] | select(.name=="gitops-demo.rules")' should return all the alerting rules that are applied to our cluster. And with this, we can proclaim victory and say we have a reasonably complete working system!
Final thoughts and considerations#
This is one hell of a learning experience, that’s for sure. While I’ve had my CKA for a while, there’s nothing like getting your hands dirty and actually building things. To finish it off, here’s some considerations that I collected during this project:
-
Using Cilium was complete overkill for this project; the reason why I chose to implement it as the ingress was that when I started this project, the K8s devs had just announced the deprecation of
nginx-ingress, and you can read about their reasoning here. I thought this would be a great opportunity to try something else, and Cilium seems to be the most natural choice.But it does introduce an extra layer of complexity, especially since we worked with K3s, which already brings an ingress and load balancer to the table. -
Implementing webhooks on Argo CD would certainly be the next step on my list, given that the default polling strategy leaves a bit to be desired. This would be a simple improvement that would greatly improve the velocity and seamlessness of our pipeline.
-
Using k9s is such a QoL improvement when dealing with even a relatively simple architecture like the one we built. Even though we only have a bit over 30 pods running across less than 10 namespaces, this really improved our visibility into what was happening with our clusters at all time. Can thoroughly recommend it to every single K8s admin, either amateur or pro.
-
Last but not least, we used k3s so simplify the deployment of our cluster, but this did introduce some friction in the configuration. I’m not against tools that take care of the abstractions, but this always comes at a cost, and we did have to battle some kinks - this is visible in the fact that we have to configure it with quite some options, and in effect it’s working pretty much as vanilla K8s cluster. Something to keep in mind.
This does conclude our project of building a completely self hosted GitOps pipeline - and I can proudly say that the objective was achieved in full. Hope that you’ve enjoyed taking this ride with me!