A bare metal monitoring stack
For a while now, I had this growing feeling that something was wrong with my main server. This is where I host most of my public services: a mail server, a bunch of websites behind nginx, PostgreSQL and MariaDB, my git forge, and a few other things. These are all services that I use for myself, which wouldn’t be a problem, but I’ve also started selling some of them to friends, family, and small businesses that want to have more control over their data. Their trust means that I have a responsibility. And that means stepping up my game.
That’s why I finally set up a proper monitoring stack. No having to troll journalctl -b or systemctl status to try and understand what was wrong, after either I went to the forge and realized it went down, or even worse, a client messages me saying that they can’t access their website. No more grey box (it was never a black box, mind you), no more late night debugging sessions, no more 10PM mails saying that the website is down. Proper observability.
The stack is what you’d expect at this point: Prometheus, Grafana and Grafana Alloy, Loki, Telegraf. Maybe Telegraf is a bit unexpected, but there’s some justification for that. We’ll get to it. But for now, here’s how it works: Telegraf scrapes pretty much all metrics I care to collect; Prometheus bundles it all up. Grafana Alloy is there to ingest the logs from journald and nginx, and then passes them to Loki. Grafana then ties it all together. Pretty simple, but with two caveats: this is all running directly on the system, and it’s not exposed to the internet.
So, let’s dive deeper into it.
The architectural decisions#
Why Telegraf#
This is not my first time trying to get a proper monitoring setup working on my main server. Back when I was building gopromtui, part of the objective was to set up the whole stack so that I’d get a good look into what was happening in my server. But, back then, I hit a few walls, the most important of which is that setting up all the Prometheus exporters is a pain in the ass. There’s no way around it.
Telegraf really makes this a breeze. So, instead of having 7 or 8 exporters (which means as many points of failure, and yet more pieces that I have to monitor), I have a single binary that I can easily deploy and set up that takes care of collecting pretty much all the information that I want to collect. Yes, now I have a single point of failure in my setup (if Telegraf stops, so does most of the collection), but this is a trade-off that I’m willing to make.
Telegraf is an actively developed project (versus several Prometheus exporters with varying levels of development and support), its configuration is simple, and if I want to add something to my monitoring pipeline, it’s just a matter of very quickly adding it to the configuration file. All of these more than make up for the downsides.
Why bare metal#
Now, this is a fun one. I could’ve just reached for a Docker Compose file to set everything up. If I had a dollar for every grafana-prometheus-loki-stack compose on the internet, I could probably go and have a nice dinner with my wife. Clone, docker compose up -d, and in less than 15 minutes I’d be pretty much up and running.
But I am of the unpopular opinion that this creates more problems than it solves. Yes, it’s fast, but it’s also a very good way to lose control over such an important part of my stack. I have written about my problems with Docker back when I upgraded my action runner setup, so there’s no point in making another post about that. But the truth is: you’re trading speed at first to having to debug docker uid mappings, docker networking, logs spread around containers; all of this is a mess when something breaks.
And it’s not like I’m losing anything here. The security implications? First, Docker is not a security boundary, and properly configured users, groups, and permissions are superior and there’s no arguing that. Second, and since all parts of this setup are available on my distro’s repos, I don’t depend on some random 3rd party to update my system quickly, and in this day and age that is priceless. Finally, having an orchestration layer when I already have all the other services running on bare metal is just deployment theater: we’re making things more complicated, without bringing anything to the table. As a follower of grug brain: complexity bad; why have more pieces when few pieces do trick?
Localhost only#
One of the main worries I had was having these services exposed online. I don’t want data to leak out of my system. So, I applied a fundamental system administration principle: services are only listening on localhost. This is another advantage of having everything running on bare metal: bind the service to localhost, and you’re good to go. No need to worry about firewalls, everything is just safe and sound. ss -tlpn helps us to confirm:
LISTEN 0      0           127.0.0.1:3100       0.0.0.0:*    users:(("loki",pid=770650,fd=6))
LISTEN 0      0           127.0.0.1:8080       0.0.0.0:*    users:(("nginx",pid=914654,fd=35),("nginx",pid=914653,fd=35))
LISTEN 0      0           127.0.0.1:12345      0.0.0.0:*    users:(("grafana-alloy",pid=822442,fd=7))
LISTEN 0      0           127.0.0.1:9090       0.0.0.0:*    users:(("prometheus",pid=818993,fd=6))
LISTEN 0      0           127.0.0.1:9273       0.0.0.0:*    users:(("telegraf",pid=771416,fd=6))
LISTEN 0      0           127.0.0.1:9900       0.0.0.0:*    users:(("stats",pid=768552,fd=12),("dovecot",pid=768543,fd=53))
The kinks#
Prometheus and sockets#
Here’s a funny thing that took me at least an hour to figure out: Prometheus doesn’t speak Unix sockets. There’s even a 3 year old issue asking for it. And I love Unix sockets, it’s how Postfix and Dovecot communicate, it’s how I expose Gitea to nginx, and it’s honestly how everything should work instead of relying on TCP.
So, we have to hack a bit here. Since I have configured Gitea to only be reachable via sockets, I had to get a bit creative. And the solution was to have nginx expose the metrics on localhost only; reverse proxying for the win, am I right?
server {
    listen 127.0.0.1:8081;
    server_name _;

    location /metrics {
        allow 127.0.0.1/32;
        deny all;
        proxy_pass http://unix:/run/gitea/gitea.socket:/metrics;
        proxy_set_header Host $host;
        proxy_pass_request_headers on;
        proxy_set_header X-Forwarded-For $proxy_add_x_forwarded_for;
    }

    location = / { return 404; }
    location /  { return 404; }
}
Dovecot and metrics#
Dovecot 2.4 had a trick up its sleeve: they scrapped their stats protocol in favour of a built-in OpenMetrics HTTP endpoint. On one hand, this makes things easier, as you just end up pointing Telegraf to scrape those metrics directly. On the other hand, there’s very little documentation for this, as it’s all very recent. Even Telegraf’s documentation assumes that we’re using the old stats protocol. But nope, we had to go exploring: an upgrade guide here, a wiki page there, some “recommended metrics” post published less than two weeks ago.
And the DSL for this? Pretty horrible, if you ask me:
metric auth_events {
  metric_filter = event=auth_request_finished
  metric_group_by success {
    metric_group_by_field = success
    metric_group_by_method discrete {}
  }
}
In the end, I had to piece together eight metrics blocks: auth events, LMTP delivery, IMAP latency, TLS handshake failures, aborted logins, and a few more, all from fragments and sparse documentation. Oh, btw, there are no histograms exposed, it’s all _total this, _duration_seconds_total that, and you’re left to compose the metrics by yourself. This wasn’t fun at all, but it’s the pains of being on the frontier, I guess!
Community dashboards#
Grafana has a very healthy community, with thousands of user-made dashboards all available for free. Import it in the web UI, point it at your datasource, done. Telegraf’s system dashboard even has more than 4,500 stars. This should be easy, right?
Absolutely not. Turns out that all these dashboards use InfluxQL functions, not standard PromQL. So we end up in the funny situation where a dashboard tagged with “Prometheus” endeds up relying on an InfluxDB setup. And I don’t have InfluxDB, nor do I care to add another database to my system just for this. So, at first, I tried to fix it. median() becomes avg by (group) (expr), ideriv() is rate(), and so on. And then, another roadblock: deprecated panel types (???). I noped out of this pretty quickly.
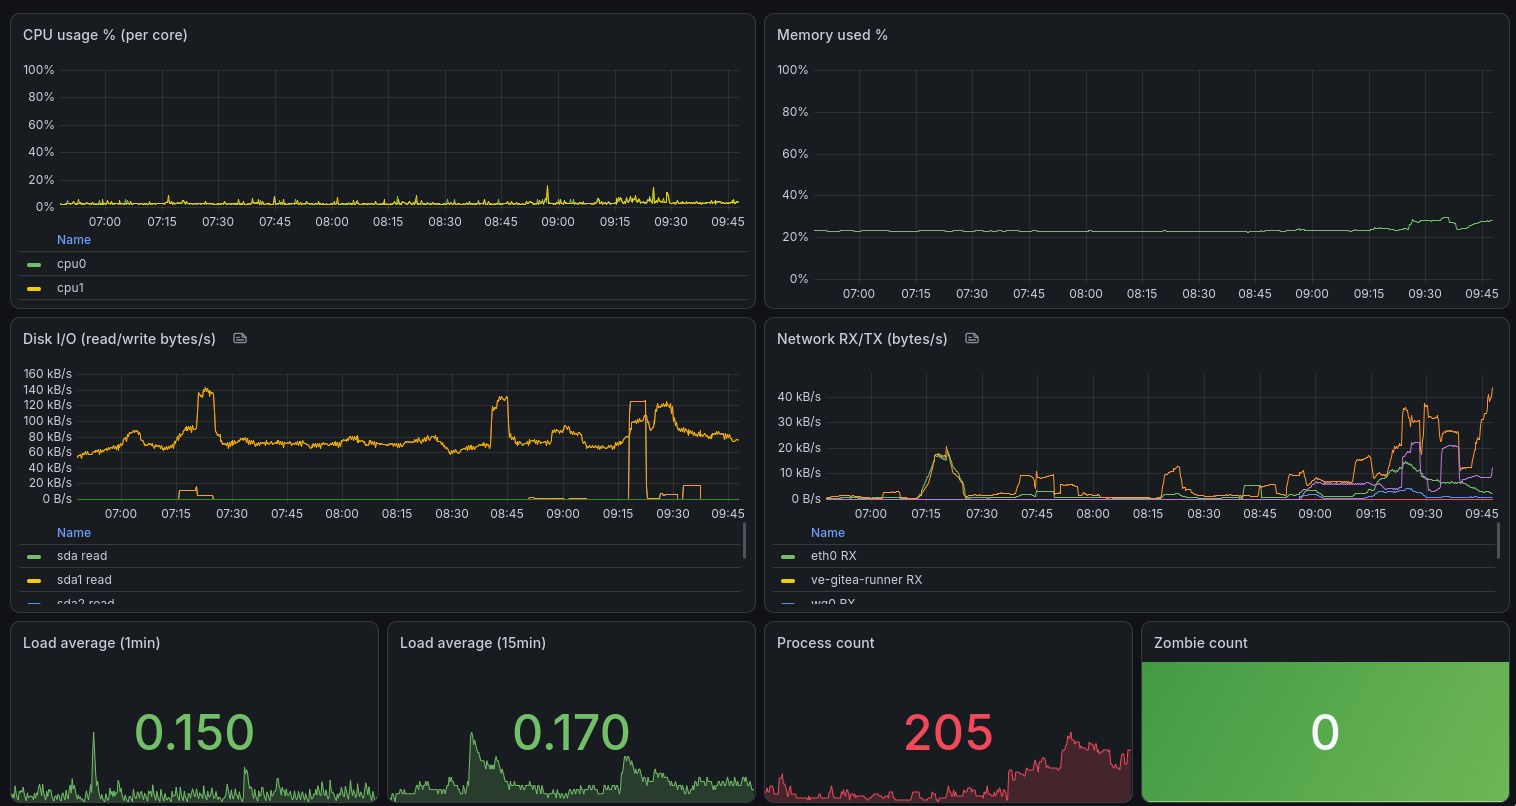
So, I started simple: three dashboards. One to validate the pipeline, with a panel for each data path (empty panel? Broken link!); a mail server health, with queries on Postfix and Dovecot metrics; and server health, with cpu/mem/disk/net from Telegraf. A ton of JSON, in the end. I still need to figure some kinks out, but it’s looking pretty good:
Closing#
This took longer than it should have, honestly. But I’m very satisfied with where I’ve landed. I’ve got a much better overview of my system’s health, as well as its components.
What’s still missing? Good question. Alerting, that’s for sure. As I’m already ingesting all of nginx’s logs through Loki, I’d love to have an automated system to let me know of elevated error rates. A pruning strategy for the logs is also called for, as I had forgotten to set limits on Loki’s ingestion and it choked hard during its first run. And for sure better dashboards, but we’ll get there.
The real takeaway isn’t about Prometheus or Telegraf or any specific tool. It’s that building your own monitoring stack is tedious, full of undocumented traps, and clearly worth it. I’ll definitely sleep better knowing that I’m on top of things now.